
Prometheus / Grafana 监控告警
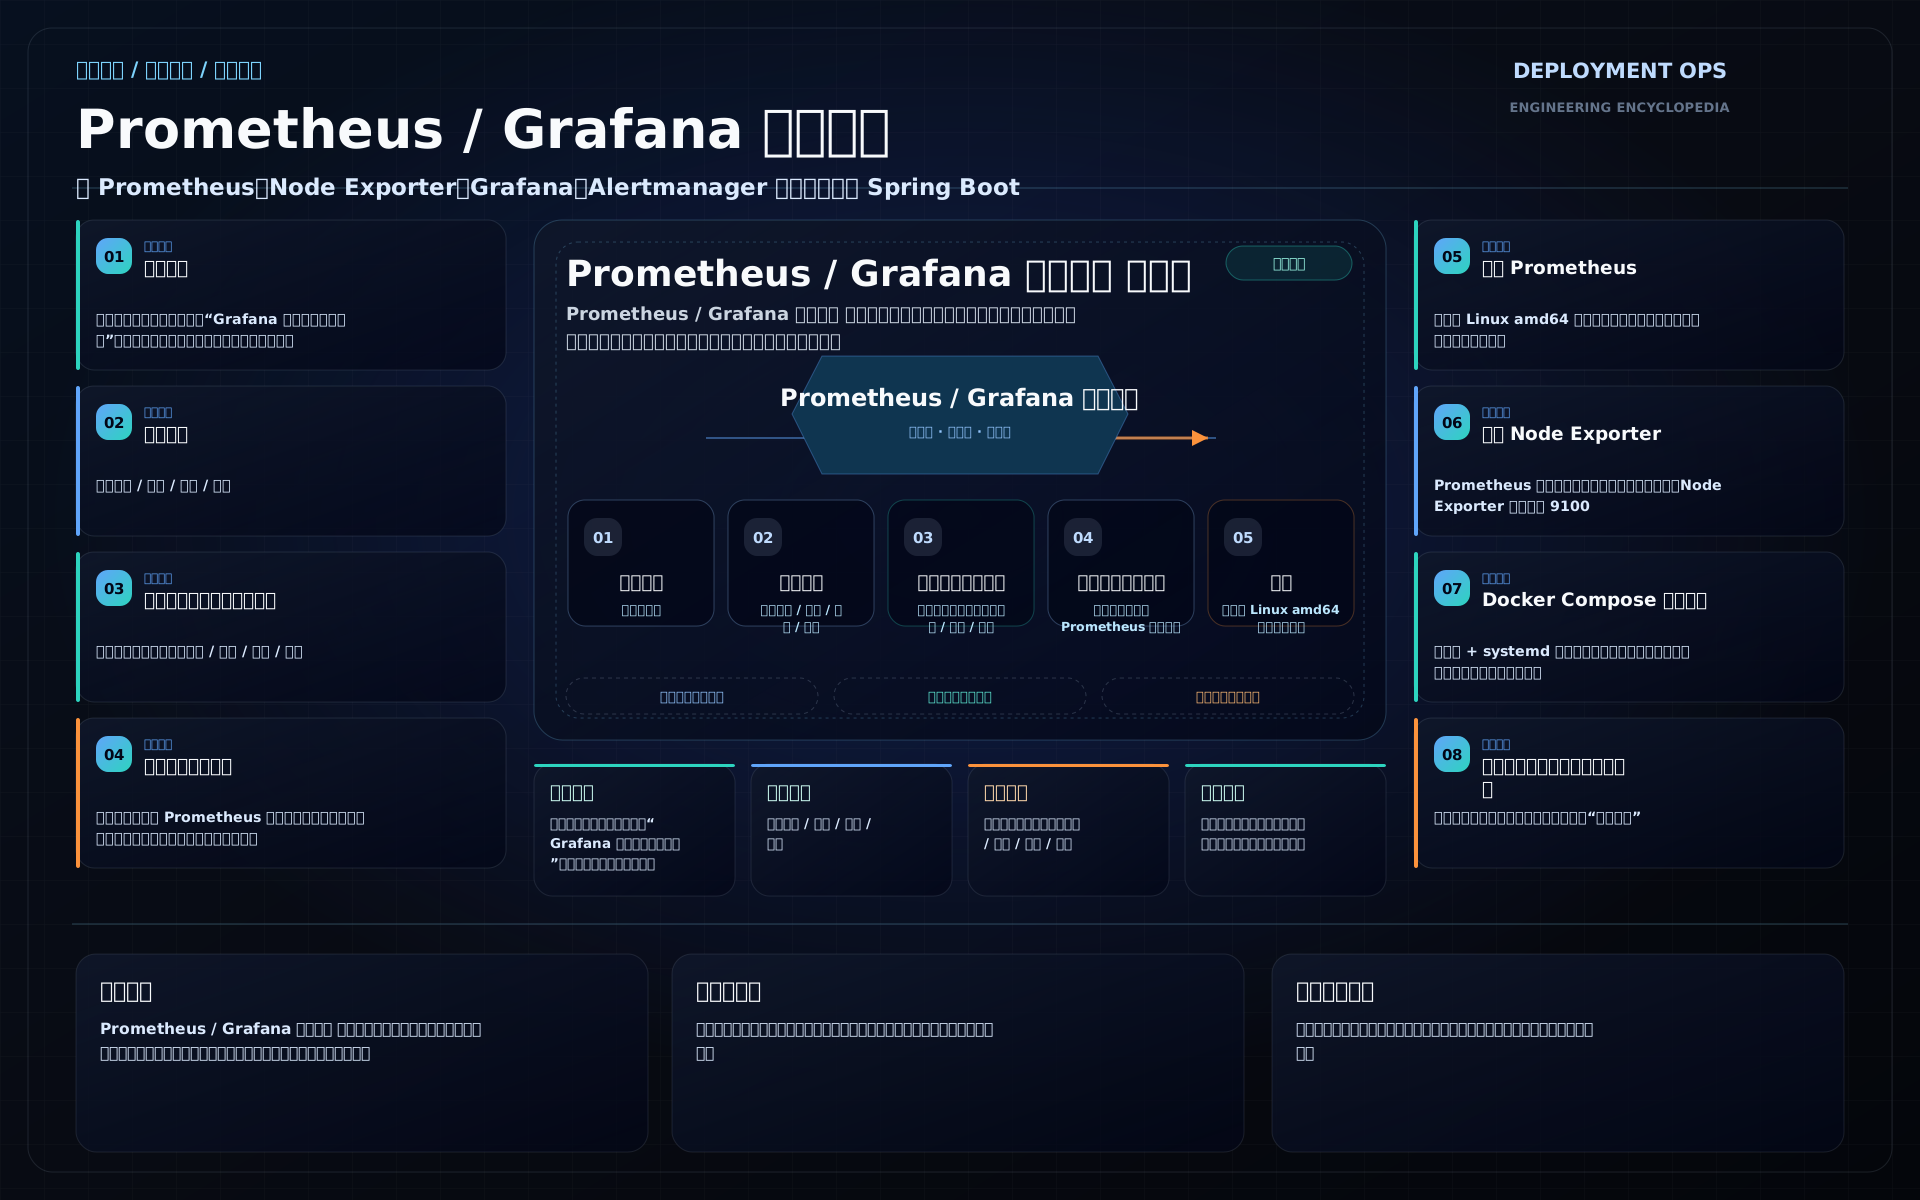
做监控告警,先不要急着问“Grafana 大屏怎么做得好看”。生产里真正有价值的监控,不是墙上那块屏,而是服务出问题前能不能提前发现,发布后能不能验证稳定,故障时能不能告诉你从哪一层查起。
这篇文章就围绕一条主线展开:用 Prometheus 采集指标,用 Grafana 看指标,用 Alertmanager 管告警和通知,用 Exporter 把主机、应用和中间件的指标暴露出来。
本文默认三类环境:
学习验证环境:一台 Linux 机器,先把 Prometheus、Node Exporter、Grafana、Alertmanager 跑起来。企业生产环境:服务分层、标签规范、告警分级、通知链路、数据保留、权限控制都要落地。中国大陆公网、企业内网、离线环境:不要默认 GitHub、Docker Hub、Grafana 插件市场、Dashboard 下载页都能稳定访问,正式部署前要准备离线包、镜像、校验文件和回退方案。
这里要注意版本。本文校准的正式版本基线是 Prometheus 3.13.1、Node Exporter 1.11.1、Alertmanager 0.33.1、Grafana 13.1.0。正式上线前再查一次官方下载页,不要把文章里的版本当成永久不变的版本锁。
SkyWalking 链路追踪,不展开日志体系,不深入 K8S Prometheus Operator,也不把 PromQL 写成完整语法手册。那些都能单独写很厚。这里先把“监控告警本身”讲透。这部分属于相邻系统的治理边界,只在影响当前链路时保留交叉点。
开始之前,先把这些条件准备好:
一台 Linux 机器或一组容器运行环境,至少能放通 Prometheus 9090、Node Exporter 9100、Alertmanager 9093、Grafana 3000 这些端口。已规划好配置目录、数据目录和运行用户,例如 /etc/prometheus、/var/lib/prometheus、/etc/alertmanager、/var/lib/grafana。有一份监控目标清单,至少包含主机名、IP、环境、集群、应用名、责任团队和端口。
已确定标签规范,env、cluster、application、team 这类标签要稳定,不要把用户 ID、订单号、原始 URL 这类动态值放进 label。已准备告警通知通道,包括邮件、Webhook、企业通知网关或值班系统,并明确谁有静默告警的权限。企业内网或离线环境已提前准备安装包、容器镜像、Grafana 插件、Dashboard JSON 和校验文件。
已给 TSDB 数据保留周期、磁盘容量和备份边界做初步估算,别等 Prometheus 自己把磁盘吃满才补救。Grafana 管理员、数据源凭证、Webhook Token 不能共用或裸奔,Prometheus 和 Alertmanager 管理端口不要直接暴露公网。
先看清这几个组件怎么配合
Prometheus 这套体系最容易被讲复杂,其实先记住四句话就够了:
Prometheus 主动去拉指标。Exporter 或应用接口负责把指标暴露成 HTTP 文本。Grafana 从 Prometheus 查询数据,然后展示成面板。
Alertmanager 接收 Prometheus 发来的告警,再做分组、抑制、静默和通知。
Prometheus 官方架构图
Prometheus 官方文档用下面这张图说明 Prometheus Server、服务发现、Pushgateway、TSDB、Alertmanager、Grafana 和 API clients 等组件的关系。这里保留官方原图,是为了对齐官方口径:Prometheus 主体是 pull 模型,短任务通过 Pushgateway 补充,告警交给 Alertmanager 继续分组、降噪和通知。

来源:Prometheus 官方文档 “Overview”。Prometheus 组件在 GitHub 上按 Apache 2 License 提供;本站保留原图用于官方口径对照。
下面这张本站重绘 Mermaid 不重复官方全量生态,而是压到本文最小落地链路:主机、应用、中间件指标怎么进 Prometheus,Grafana 从哪里查,告警最终从哪里发出去。排障时也按这条链路倒着查。
这里有一个基本判断:Prometheus 默认是 pull 模型,不是应用主动推指标。应用要做的是暴露 /metrics 或 /actuator/prometheus,然后 Prometheus 按配置定时来抓。只有短任务、批处理任务这类不适合被持续 scrape 的场景,才考虑 Pushgateway,而且也要单独评估生命周期和指标清理。
现场排障时,也按这个链路倒着查:
Grafana 没数据,先查 Prometheus 有没有数据。Prometheus 没数据,先查 Targets 是不是 UP。Targets DOWN,先查目标地址、端口、防火墙、路径和超时。
指标有了但告警不触发,再查规则表达式、for 时间、evaluation_interval 和 Alertmanager。告警触发了但没人收到,再查 Alertmanager 路由、接收器、模板、通知网关和外部网络。
先准备目录和用户
生产环境不要把 Prometheus 直接丢在当前目录里跑。先把配置、数据、规则和程序目录分清楚。
sudo useradd --no-create-home --shell /usr/sbin/nologin prometheus
sudo mkdir -p /etc/prometheus/rules
sudo mkdir -p /var/lib/prometheus
sudo mkdir -p /opt/prometheus
sudo chown -R prometheus:prometheus /etc/prometheus /var/lib/prometheus /opt/prometheus
这几条命令解决的是运行身份和目录边界问题:
/etc/prometheus 放配置和规则。/var/lib/prometheus 放本地 TSDB 数据。/opt/prometheus 可以放解压后的原始包或版本目录。
prometheus 用户只负责运行服务,不给登录 shell。
执行后可以这样验证:
id prometheus
sudo -u prometheus test -w /var/lib/prometheus && echo "Prometheus 数据目录可写"
如果第二条没有输出,先查权限:
namei -l /var/lib/prometheus很多启动失败不是 Prometheus 配置错了,而是数据目录某一级没有权限。
安装 Prometheus
这里用 Linux amd64 二进制包举例。其他架构按官方下载页选择对应包。
tar -xzf prometheus-3.13.1.linux-amd64.tar.gz
cd prometheus-3.13.1.linux-amd64

sudo cp prometheus promtool /usr/local/bin/
sudo cp -r consoles console_libraries /etc/prometheus/
sudo chown prometheus:prometheus /usr/local/bin/prometheus /usr/local/bin/promtool
sudo chown -R prometheus:prometheus /etc/prometheus
先看版本:
prometheus --version
promtool --version
如果命令不存在,说明 /usr/local/bin 不在当前用户的 PATH 里,或者复制失败。先别写 systemd,把二进制命令验证通过再继续。
创建一个最小配置:
sudo tee /etc/prometheus/prometheus.yml >/dev/null <<'EOF'
global:
  scrape_interval: 15s
  evaluation_interval: 15s

scrape_configs:
  - job_name: "prometheus"
    static_configs:
      - targets: ["localhost:9090"]
EOF

sudo chown prometheus:prometheus /etc/prometheus/prometheus.yml
用 promtool 先检查配置:
promtool check config /etc/prometheus/prometheus.yml看到 SUCCESS 再启动。这里要养成习惯:Prometheus 配置和告警规则都先 check,再 reload 或 restart。生产上少一次手滑,可能就少一次半夜告警。
写 systemd:
sudo tee /etc/systemd/system/prometheus.service >/dev/null <<'EOF'
[Unit]
Description=Prometheus Monitoring
Wants=network-online.target
After=network-online.target

[Service]
User=prometheus
Group=prometheus
Type=simple
ExecStart=/usr/local/bin/prometheus \
  --config.file=/etc/prometheus/prometheus.yml \
  --storage.tsdb.path=/var/lib/prometheus \
  --storage.tsdb.retention.time=15d \
  --storage.tsdb.retention.size=20GB \
  --web.console.templates=/etc/prometheus/consoles \
  --web.console.libraries=/etc/prometheus/console_libraries \
  --web.enable-lifecycle
Restart=on-failure
RestartSec=5s
LimitNOFILE=65536

[Install]
WantedBy=multi-user.target
EOF

sudo systemctl daemon-reload
sudo systemctl enable --now prometheus
验证:
systemctl status prometheus --no-pager
curl -fsS http://localhost:9090/-/healthy
curl -fsS http://localhost:9090/-/ready
curl -fsS http://localhost:9090/metrics | head正常情况下,/-/healthy 和 /-/ready 都会返回可读的健康信息,/metrics 能看到 Prometheus 自己暴露的指标。
这里要注意 --web.enable-lifecycle。开启后可以通过 HTTP POST 触发 reload:
curl -X POST http://localhost:9090/-/reload这对生产很方便,但不要把 Prometheus 管理端口直接暴露到公网。Prometheus、Alertmanager、Grafana、Exporter 的端口都应该只对内网或受控入口开放。
安装 Node Exporter
Prometheus 自己起来以后,下一步先监控主机。Node Exporter 默认监听 9100,负责暴露 CPU、内存、磁盘、inode、网络、load 等系统指标。
sudo useradd --no-create-home --shell /usr/sbin/nologin node_exporter

tar -xzf node_exporter-1.11.1.linux-amd64.tar.gz
cd node_exporter-1.11.1.linux-amd64

sudo cp node_exporter /usr/local/bin/
sudo chown node_exporter:node_exporter /usr/local/bin/node_exporter
写服务:
sudo tee /etc/systemd/system/node_exporter.service >/dev/null <<'EOF'
[Unit]
Description=Prometheus Node Exporter
Wants=network-online.target
After=network-online.target

[Service]
User=node_exporter
Group=node_exporter
Type=simple
ExecStart=/usr/local/bin/node_exporter \
  --collector.filesystem.mount-points-exclude=^/(dev|proc|sys|run|var/lib/docker/.+|var/lib/kubelet/.+)($|/)
Restart=on-failure
RestartSec=5s

[Install]
WantedBy=multi-user.target
EOF

sudo systemctl daemon-reload
sudo systemctl enable --now node_exporter
验证:
systemctl status node_exporter --no-pager
curl -fsS http://localhost:9100/metrics | head
curl -fsS http://localhost:9100/metrics | grep -E "node_cpu_seconds_total|node_memory_MemAvailable_bytes|node_filesystem_avail_bytes" | head
如果本机能访问,Prometheus 机器访问不到,就不要盯着 Node Exporter。按顺序查:
ss -lntp | grep 9100
curl -fsS http://<node-host>:9100/metrics | head
再查防火墙、安全组、主机名解析和网络 ACL。Exporter 启了,不代表 Prometheus 所在机器一定能访问。
把 Node Exporter 加入 Prometheus:
scrape_configs:
  - job_name: "prometheus"
    static_configs:
      - targets: ["localhost:9090"]

  - job_name: "node"
    static_configs:
      - targets:
          - "node-a:9100"
          - "node-b:9100"
        labels:
          env: "prod"
          layer: "host"
检查并 reload:
promtool check config /etc/prometheus/prometheus.yml
curl -X POST http://localhost:9090/-/reload
然后打开 Prometheus 的 Targets 页面,或者用 API 看状态:
curl -fsS "http://localhost:9090/api/v1/targets?state=active" | headTargets 里 node 任务应该是 UP。如果是 DOWN,先点开错误信息,通常会直接告诉你是连接拒绝、超时、DNS 解析失败,还是 HTTP 状态码不对。
Docker Compose 快速部署
二进制 + systemd 更像生产虚拟机的部署方式。学习、演示、内网一体机验证时,用 Compose 跑最小闭环会快很多。
目录可以这样放:
monitoring/
  compose.yml
  prometheus/
    prometheus.yml
    rules/
  alertmanager/
    alertmanager.yml
  grafana/
    provisioning/
      datasources/
        prometheus.yml
compose.yml 示例:
services:
  prometheus:
    image: prom/prometheus:v3.13.1
    container_name: prometheus
    command:
      - "--config.file=/etc/prometheus/prometheus.yml"
      - "--storage.tsdb.path=/prometheus"
      - "--storage.tsdb.retention.time=15d"
      - "--storage.tsdb.retention.size=20GB"
      - "--web.enable-lifecycle"
    ports:
      - "9090:9090"
    volumes:
      - ./prometheus:/etc/prometheus:ro
      - prometheus-data:/prometheus
    restart: unless-stopped

  alertmanager:
    image: quay.io/prometheus/alertmanager:v0.33.1
    container_name: alertmanager
    command:
      - "--config.file=/etc/alertmanager/alertmanager.yml"
    ports:
      - "9093:9093"
    volumes:
      - ./alertmanager:/etc/alertmanager:ro
    restart: unless-stopped

  grafana:
    image: grafana/grafana:13.1.0
    container_name: grafana
    ports:
      - "3000:3000"
    volumes:
      - grafana-data:/var/lib/grafana
      - ./grafana/provisioning:/etc/grafana/provisioning:ro
    environment:
      GF_SECURITY_ADMIN_USER: admin
      GF_SECURITY_ADMIN_PASSWORD: change-me-before-prod
      GF_USERS_ALLOW_SIGN_UP: "false"
    restart: unless-stopped

  node-exporter:
    image: quay.io/prometheus/node-exporter:v1.11.1
    container_name: node-exporter
    network_mode: host
    pid: host
    command:
      - "--path.rootfs=/host"
      - "--collector.filesystem.mount-points-exclude=^/(dev|proc|sys|run|var/lib/docker/.+|var/lib/kubelet/.+)($|/)"
    volumes:
      - "/:/host:ro,rslave"
    restart: unless-stopped

volumes:
  prometheus-data:
  grafana-data:
这里有几个地方要注意:
Grafana 的密码示例一定要改,生产不要用默认密码。Node Exporter 放容器里监控宿主机时,不能只 docker run -p 9100:9100,要让它看到宿主机文件系统和命名空间。Prometheus 数据目录一定要挂 volume,否则容器删了数据也没了。
Compose 适合单机和验证,多节点高可用、自动发现、长期存储不是这段配置要解决的问题。
启动:
docker compose up -d
docker compose ps
curl -fsS http://localhost:9090/-/ready
curl -fsS http://localhost:9093/-/healthy
curl -fsS http://localhost:3000/api/health
如果 Grafana 返回健康信息,说明页面服务起来了。接下来访问 http://<server-host>:3000,配置 Prometheus 数据源,URL 在同一个 Compose 网络里可以写 http://prometheus:9090。
也可以用 provisioning 预置数据源:
apiVersion: 1

datasources:
  - name: Prometheus
    type: prometheus
    access: proxy
    url: http://prometheus:9090
    isDefault: true
    editable: true
中国大陆、企业内网和离线环境
监控系统经常不是卡在配置,而是卡在“下载不到”。Prometheus、Alertmanager、Node Exporter、Grafana、Grafana 插件、Dashboard JSON、Docker 镜像,都可能在企业网络里不可达。
公网环境里可以先下载,再做校验:
sha256sum prometheus-3.13.1.linux-amd64.tar.gz
sha256sum node_exporter-1.11.1.linux-amd64.tar.gz
sha256sum alertmanager-0.33.1.linux-amd64.tar.gz
把输出和官方下载页给出的 SHA256 对上。离线分发时,建议把包和校验文件一起放进企业制品库:
prometheus-3.13.1.linux-amd64.tar.gz
prometheus-3.13.1.linux-amd64.tar.gz.sha256
node_exporter-1.11.1.linux-amd64.tar.gz
node_exporter-1.11.1.linux-amd64.tar.gz.sha256
alertmanager-0.33.1.linux-amd64.tar.gz
alertmanager-0.33.1.linux-amd64.tar.gz.sha256
grafana-enterprise_13.1.0_amd64.deb
grafana-enterprise-13.1.0-1.x86_64.rpm
Docker 镜像也一样。不要到生产机上临时拉镜像,先在有公网或代理的构建机上准备:
docker pull prom/prometheus:v3.13.1
docker pull quay.io/prometheus/alertmanager:v0.33.1
docker pull quay.io/prometheus/node-exporter:v1.11.1
docker pull grafana/grafana:13.1.0

docker save \
  prom/prometheus:v3.13.1 \
  quay.io/prometheus/alertmanager:v0.33.1 \
  quay.io/prometheus/node-exporter:v1.11.1 \
  grafana/grafana:13.1.0 \
  -o monitoring-images-<RUN_ID>.tar

sha256sum monitoring-images-<RUN_ID>.tar > monitoring-images-<RUN_ID>.tar.sha256
离线环境导入:
sha256sum -c monitoring-images-<RUN_ID>.tar.sha256
docker load -i monitoring-images-<RUN_ID>.tar
docker images | grep -E "prometheus|alertmanager|node-exporter|grafana"
Grafana Dashboard 和插件也要提前准备。很多团队第一次上线 Grafana,面板能打开,但导入 Dashboard 时发现外网访问不了。生产建议:
Dashboard JSON 固化到代码仓库或配置仓库。插件包走企业制品库,安装后记录版本。不把某个社区 Dashboard ID 写成唯一方案,因为社区 Dashboard 会变化,也不一定适配你的指标标签。
自己维护主机、JVM、应用接口、Nginx、MySQL、Redis、MQ 这几类基础看板。
Prometheus 配置怎么写
Prometheus 的核心配置就是 prometheus.yml。最小生产结构一般长这样:
global:
  scrape_interval: 15s
  scrape_timeout: 10s
  evaluation_interval: 15s
  external_labels:
    monitor: "prod-monitor"
    env: "prod"

rule_files:
  - /etc/prometheus/rules/*.yml

alerting:
  alertmanagers:
    - static_configs:
        - targets:
            - "localhost:9093"

scrape_configs:
  - job_name: "prometheus"
    static_configs:
      - targets: ["localhost:9090"]

  - job_name: "node"
    metrics_path: "/metrics"
    static_configs:
      - targets:
          - "node-a:9100"
          - "node-b:9100"
        labels:
          env: "prod"
          layer: "host"

  - job_name: "spring-boot"
    metrics_path: "/actuator/prometheus"
    static_configs:
      - targets:
          - "order-service-a:8080"
          - "order-service-b:8080"
        labels:
          env: "prod"
          application: "order-service"
逐项看:
scrape_interval:默认抓取间隔。太短会增加 Prometheus 和目标服务压力,太长会降低发现速度。scrape_timeout:单次抓取超时时间,不能大于抓取间隔。evaluation_interval:告警和 recording rule 的评估间隔。
external_labels:发给 Alertmanager 或远程存储时附加的外部标签,适合标记环境、集群、监控实例。rule_files:告警规则文件入口。alerting.alertmanagers:告警发给哪些 Alertmanager。
job_name:一类抓取任务,Prometheus 会把它写入 job 标签。targets:具体抓取目标,Prometheus 会写入 instance 标签。metrics_path:抓取路径,普通 exporter 多数是 /metrics,Spring Boot 常用 /actuator/prometheus。
这里要注意标签命名。标签不是越多越好,标签值也不能乱。生产上建议至少统一这些标签:
| 标签 | 用途 | 示例 |
|---|---|---|
env | 环境 | dev、test、prod |
application | 应用名 | order-service |
team | 责任团队 | payment |
layer | 资源层级 | host、app、middleware |
cluster | 集群 | prod-a |
不要把用户 ID、订单号、手机号、请求参数这类高基数或敏感内容放进 label。Prometheus 的查询能力来自 label,但磁盘和内存压力也常常来自 label。
relabel_configs 可以改写目标标签、过滤目标、统一命名。本文只讲边界,先给一个简单例子:
scrape_configs:
  - job_name: "node"
    static_configs:
      - targets: ["node-a:9100"]
        labels:
          hostname: "node-a"
    relabel_configs:
      - source_labels: [hostname]
        target_label: instance
这里把 hostname 改写成 instance,让 Grafana 面板里显示更友好。生产上不要一开始就堆复杂 relabel,先把静态目标、标签规范和基础看板跑稳,再逐步引入服务发现和 relabel。
数据目录和保留周期
Prometheus 自带本地 TSDB。它不是只占一点配置文件空间,而是会持续写磁盘。必须提前规划:
du -sh /var/lib/prometheus
df -h /var/lib/prometheus
systemd 里这两个参数最常用:
--storage.tsdb.path=/var/lib/prometheus
--storage.tsdb.retention.time=15d
--storage.tsdb.retention.size=20GB
如果同时设置时间和大小,哪个先触发就按哪个清理。比如你设置 15d 和 20GB,数据增长太快时,可能还没到 15 天就因为超过 20GB 删除旧数据。
容量粗略估算可以按这个思路:
需要磁盘空间 ≈ 保留时间秒数 × 每秒样本数 × 每样本字节数Prometheus 官方文档给出的经验是平均每个样本约 1 到 2 字节,但生产上还要考虑 WAL、峰值、索引、压缩和查询压力。落地时建议保守一些:
学习环境:7 到 15 天,几 GB 到几十 GB。普通业务环境:15 到 30 天,按目标数量和抓取间隔评估。长期趋势分析:不要硬扛在单机 Prometheus 上,考虑远程存储或专门方案。
如果磁盘被 Prometheus 打满,先做这几步:
systemctl stop prometheus
du -h --max-depth=1 /var/lib/prometheus | sort -h
df -h
journalctl -u prometheus -n 100 --no-pager
不要上来就 rm -rf /var/lib/prometheus/*。如果数据还有价值,先备份目录,再调整保留周期、抓取间隔、目标数量和高基数指标。
Node Exporter 指标怎么看
Node Exporter 暴露的指标很多,不需要一上来全背。生产排障先抓几个关键入口。
CPU 使用率常用:
100 - (avg by (instance) (rate(node_cpu_seconds_total{mode="idle"}[5m])) * 100)这条语句的意思是:过去 5 分钟 CPU 非 idle 的比例。执行后应该按实例返回百分比。如果没有数据,先查 node_cpu_seconds_total 是否存在。
内存使用率:
100 * (1 - (node_memory_MemAvailable_bytes / node_memory_MemTotal_bytes))这里用 MemAvailable,比只看 free 更接近 Linux 实际可用内存。Linux 会把内存用于缓存,所以看到 free 很低不一定是问题,要结合 MemAvailable 和 swap。
磁盘使用率:
100 * (1 - (
  node_filesystem_avail_bytes{fstype!~"tmpfs|overlay|squashfs"} /
  node_filesystem_size_bytes{fstype!~"tmpfs|overlay|squashfs"}
))
inode 使用率:
100 * (1 - (
  node_filesystem_files_free{fstype!~"tmpfs|overlay|squashfs"} /
  node_filesystem_files{fstype!~"tmpfs|overlay|squashfs"}
))
这里要注意:磁盘空间没满,不代表 inode 没满。日志碎片、小文件、临时文件特别多时,inode 先满,服务一样写不了文件。
系统负载:
node_load1
node_load5
node_load15
load 要结合 CPU 核数看。单看 node_load1 = 8 没意义,2 核机器和 32 核机器完全不是一回事。可以配合:
count by (instance) (node_cpu_seconds_total{mode="idle"})网络收发:
rate(node_network_receive_bytes_total{device!~"lo"}[5m])
rate(node_network_transmit_bytes_total{device!~"lo"}[5m])
生产建议:Node Exporter 看板至少包含 CPU、load、内存、swap、磁盘空间、inode、磁盘 I/O、网络、文件句柄、系统启动时间。不要只看 CPU 和内存,那样很容易漏掉磁盘、inode 和网络问题。
Spring Boot 指标接入 Prometheus
Java 微服务最常见的接入方式是 Spring Boot Actuator + Micrometer Prometheus registry。
Maven 依赖:
<dependency>
  <groupId>org.springframework.boot</groupId>
  <artifactId>spring-boot-starter-actuator</artifactId>
</dependency>

<dependency>
  <groupId>io.micrometer</groupId>
  <artifactId>micrometer-registry-prometheus</artifactId>
</dependency>
配置:
spring:
  application:
    name: order-service

management:
  endpoints:
    web:
      exposure:
        include: health,info,prometheus,metrics
  endpoint:
    health:
      show-details: when_authorized
  metrics:
    tags:
      application: ${spring.application.name}
      env: ${APP_ENV:dev}
启动后验证:
curl -fsS http://localhost:8080/actuator/health
curl -fsS http://localhost:8080/actuator/prometheus | head
如果 /actuator/prometheus 是 404,按这个顺序查:
有没有引入 spring-boot-starter-actuator。有没有引入 micrometer-registry-prometheus。management.endpoints.web.exposure.include 是否包含 prometheus。
管理端口是否和应用端口分开配置了。是否被网关、认证、Nginx、Service Mesh 拦住了。
Prometheus 配置:
scrape_configs:
  - job_name: "spring-boot"
    metrics_path: "/actuator/prometheus"
    static_configs:
      - targets:
          - "order-service-a:8080"
          - "order-service-b:8080"
        labels:
          env: "prod"
application: "order-service"这里要注意,application 标签最好在应用端和 Prometheus 配置里保持一致。多环境不要只靠端口区分,要有明确的 env 标签。否则 Grafana 一查询,很容易把测试环境和生产环境混在一起。
常看指标包括:
| 方向 | 常见指标 |
|---|---|
| HTTP 请求量 | http_server_requests_seconds_count |
| HTTP 耗时 | http_server_requests_seconds_sum、http_server_requests_seconds_count |
| HTTP 错误 | status=~"5.." 维度 |
| JVM 堆内存 | jvm_memory_used_bytes、jvm_memory_max_bytes |
| GC | jvm_gc_pause_seconds_count、jvm_gc_pause_seconds_sum |
| 线程 | jvm_threads_live_threads、jvm_threads_states_threads |
| 进程 CPU | process_cpu_usage |
| 系统 CPU | system_cpu_usage |
一个接口平均耗时查询可以这样写:
sum by (application, uri, method) (rate(http_server_requests_seconds_sum[5m]))
/
sum by (application, uri, method) (rate(http_server_requests_seconds_count[5m]))
如果这个查询结果为空,不一定是 Prometheus 坏了。先直接打开 /actuator/prometheus 搜 http_server_requests,确认应用有没有实际请求、指标名是否被版本或配置改过。
Grafana 怎么接 Prometheus
Grafana 安装方式可以按官方文档选择 Debian / Ubuntu、RHEL / Fedora、Docker、Kubernetes 或 Helm。这里先看最常用的接入动作。
登录 Grafana 后,添加数据源:
类型选择 Prometheus。URL 填 Prometheus 地址,比如 http://prometheus:9090 或内部监控地址。保存并测试。
如果测试失败,先别急着改 Dashboard:
curl -fsS http://prometheus:9090/-/ready
curl -fsS http://prometheus:9090/api/v1/query?query=up
在 Grafana 容器里也要测:
docker exec -it grafana sh
wget -qO- http://prometheus:9090/-/ready
很多“Grafana 连不上 Prometheus”,其实是容器网络、服务名、DNS 或防火墙问题,不是 Grafana 配置页的问题。
Dashboard 导入建议分两类:
先导入社区成熟 Dashboard,快速看到主机和 JVM 指标。再按团队自己的标签、服务名、环境、接口规范改造成内部模板。
常见看板至少有这些:
| 看板 | 看什么 |
|---|---|
| 主机 | CPU、load、内存、磁盘、inode、网络、文件句柄 |
| JVM | 堆、非堆、GC、线程、类加载、进程 CPU |
| 应用接口 | QPS、错误率、平均耗时、P95 / P99、慢接口 |
| Nginx | 请求量、状态码、上游耗时、连接数 |
| MySQL | up、连接数、QPS、慢查询、复制、Buffer Pool |
| Redis | up、内存、连接、命中率、慢命令、主从 |
| MQ | 节点存活、队列积压、消费者、磁盘水位 |
Dashboard 不是越多越好。生产上经常出现两个问题:
面板太多,没人知道故障时先看哪一张。每张面板都自动 5 秒刷新,把 Prometheus 查询打爆。
建议把 Dashboard 分层:
值班首页:只放核心服务健康、错误率、RT、资源水位、当前告警。排障看板:按主机、应用、数据库、缓存、MQ 拆开。专项看板:容量、发布验证、业务指标、SLO。
安装 Alertmanager
Prometheus 负责判断“什么规则触发了”,Alertmanager 负责判断“怎么通知、通知谁、怎么降噪”。
安装:
sudo useradd --no-create-home --shell /usr/sbin/nologin alertmanager
sudo mkdir -p /etc/alertmanager /var/lib/alertmanager
sudo chown -R alertmanager:alertmanager /etc/alertmanager /var/lib/alertmanager

tar -xzf alertmanager-0.33.1.linux-amd64.tar.gz
cd alertmanager-0.33.1.linux-amd64

sudo cp alertmanager amtool /usr/local/bin/
sudo chown alertmanager:alertmanager /usr/local/bin/alertmanager /usr/local/bin/amtool
写最小配置:
sudo tee /etc/alertmanager/alertmanager.yml >/dev/null <<'EOF'
global:
  resolve_timeout: 5m

route:
  receiver: "default-webhook"
  group_by: ["alertname", "env", "application"]
  group_wait: 30s
  group_interval: 5m
  repeat_interval: 4h

receivers:
  - name: "default-webhook"
    webhook_configs:
      - url: "https://alert-webhook.example.com/prometheus"
        send_resolved: true
EOF

sudo chown alertmanager:alertmanager /etc/alertmanager/alertmanager.yml
这里的 url 是示例占位。生产上建议接企业内部通知网关,再由通知网关转发到邮件、企业微信、钉钉、飞书、短信或电话。这样 Alertmanager 不需要直接保存一堆第三方 token,也方便做审计、限流和值班人路由。
写服务:
sudo tee /etc/systemd/system/alertmanager.service >/dev/null <<'EOF'
[Unit]
Description=Prometheus Alertmanager
Wants=network-online.target
After=network-online.target

[Service]
User=alertmanager
Group=alertmanager
Type=simple
ExecStart=/usr/local/bin/alertmanager \
  --config.file=/etc/alertmanager/alertmanager.yml \
  --storage.path=/var/lib/alertmanager
Restart=on-failure
RestartSec=5s

[Install]
WantedBy=multi-user.target
EOF

sudo systemctl daemon-reload
sudo systemctl enable --now alertmanager
验证:
systemctl status alertmanager --no-pager
curl -fsS http://localhost:9093/-/healthy
amtool --alertmanager.url=http://localhost:9093 config show
Prometheus 里配置 Alertmanager:
alerting:
  alertmanagers:
    - static_configs:
        - targets:
            - "localhost:9093"
检查并 reload:
promtool check config /etc/prometheus/prometheus.yml
curl -X POST http://localhost:9090/-/reload
告警规则怎么写
先建规则文件:
sudo tee /etc/prometheus/rules/basic-alerts.yml >/dev/null <<'EOF'
groups:
  - name: basic-alerts
    rules:
      - alert: InstanceDown
        expr: up == 0
        for: 5m
        labels:
          severity: critical
        annotations:
          summary: "实例不可用"
          description: "{{ $labels.job }} / {{ $labels.instance }} 已经连续 5 分钟不可用。"
EOF

sudo chown prometheus:prometheus /etc/prometheus/rules/basic-alerts.yml
检查规则:
promtool check rules /etc/prometheus/rules/basic-alerts.yml
promtool check config /etc/prometheus/prometheus.yml
curl -X POST http://localhost:9090/-/reload
打开 Prometheus 的 Alerts 页面,应该能看到规则。如果目标真的 DOWN,先进入 pending,持续满足 for: 5m 后再 firing。
这里要注意三个概念:
expr 是判断条件。for 是持续多久才算触发,防止瞬时抖动。labels 用于路由和分级,annotations 用于说明和排障提示。
告警不是越多越好。生产上更重要的是“该响的时候响,不该响的时候别吵”。Alertmanager 的核心能力正是分组、抑制和静默:
| 能力 | 解决什么问题 |
|---|---|
| 分组 | 同一类告警合并成一条通知,避免刷屏 |
| 抑制 | 上游故障已触发时,压住下游连锁告警 |
| 静默 | 维护窗口、发布窗口临时屏蔽指定告警 |
| repeat | 故障未恢复时按周期提醒,不每分钟轰炸 |
比如数据库不可用时,几十个应用都会报错。此时真正应该先通知的是数据库不可用,而不是每个接口都发一条 HTTP 5xx 告警。
Alertmanager 告警流转图
告警规则评审不要只看 PromQL 对不对,还要把 pending、firing、Alertmanager 分组、去重、静默、抑制、路由和最终通知串起来。否则规则看着都很合理,真正故障时却会变成告警风暴,或者被一条过宽的 silence 静默掉。
上线检查时,先用 promtool check rules 和 Prometheus Alerts 页面确认规则能从 pending 进入 firing,再用 amtool alert query 看 Alertmanager 是否收到;维护窗口用 amtool silence 或 Grafana Silences 管理,连锁故障用 inhibition,而不是临时删规则。Grafana Alerting 可以自己评估规则,也可以把 Grafana-managed alerts 发给外部 Alertmanager;团队要提前决定谁是主告警入口,避免 Prometheus 和 Grafana 对同一故障重复通知。
常用告警规则模板
下面这些规则不是拿去就完事,而是作为起点。阈值一定要结合业务峰谷、机器规格、压测结果和历史数据调整。
主机不可用:
- alert: InstanceDown
  expr: up == 0
  for: 5m
  labels:
    severity: critical
  annotations:
    summary: "实例不可用"
    description: "{{ $labels.job }} / {{ $labels.instance }} 连续 5 分钟抓取失败。"
CPU 使用率高:
- alert: HostHighCpuUsage
  expr: 100 - (avg by (instance) (rate(node_cpu_seconds_total{mode="idle"}[5m])) * 100) > 85
  for: 10m
  labels:
    severity: warning
  annotations:
    summary: "主机 CPU 使用率过高"
    description: "{{ $labels.instance }} CPU 使用率连续 10 分钟超过 85%。"
内存使用率高:
- alert: HostHighMemoryUsage
  expr: 100 * (1 - (node_memory_MemAvailable_bytes / node_memory_MemTotal_bytes)) > 90
  for: 10m
  labels:
    severity: warning
  annotations:
    summary: "主机内存使用率过高"
    description: "{{ $labels.instance }} 可用内存不足,内存使用率超过 90%。"
磁盘空间不足:
- alert: HostDiskSpaceLow
  expr: 100 * (1 - (node_filesystem_avail_bytes{fstype!~"tmpfs|overlay|squashfs"} / node_filesystem_size_bytes{fstype!~"tmpfs|overlay|squashfs"})) > 85
  for: 10m
  labels:
    severity: warning
  annotations:
    summary: "磁盘空间不足"
    description: "{{ $labels.instance }} {{ $labels.mountpoint }} 使用率超过 85%。"
inode 不足:
- alert: HostInodesLow
  expr: 100 * (1 - (node_filesystem_files_free{fstype!~"tmpfs|overlay|squashfs"} / node_filesystem_files{fstype!~"tmpfs|overlay|squashfs"})) > 85
  for: 10m
  labels:
    severity: warning
  annotations:
    summary: "inode 使用率过高"
    description: "{{ $labels.instance }} {{ $labels.mountpoint }} inode 使用率超过 85%。"
HTTP 5xx 比例高:
- alert: AppHighHttp5xxRate
  expr: |
    (
      sum by (application) (rate(http_server_requests_seconds_count{status=~"5.."}[5m]))
      /
      sum by (application) (rate(http_server_requests_seconds_count[5m]))
    ) > 0.05
  for: 5m
  labels:
    severity: critical
  annotations:
    summary: "应用 5xx 错误率过高"
    description: "{{ $labels.application }} 最近 5 分钟 5xx 比例超过 5%。"
JVM 堆内存使用率高:
- alert: JvmHeapUsageHigh
  expr: |
    sum by (application, instance) (jvm_memory_used_bytes{area="heap"})
    /
    sum by (application, instance) (jvm_memory_max_bytes{area="heap"})
    > 0.85
  for: 10m
  labels:
    severity: warning
  annotations:
    summary: "JVM 堆内存使用率过高"
    description: "{{ $labels.application }} / {{ $labels.instance }} 堆内存使用率超过 85%。"
MySQL / Redis / MQ 可用性通常依赖各自 exporter 的 up 或组件特定指标。比如:
- alert: MySQLExporterDown
  expr: up{job="mysql"} == 0
  for: 5m
  labels:
    severity: critical
  annotations:
    summary: "MySQL Exporter 不可用"
    description: "{{ $labels.instance }} MySQL 指标抓取失败。"
这里要注意,Exporter DOWN 和数据库 DOWN 不是一回事。Exporter DOWN 可能只是 exporter 挂了、网络不通、认证失败;数据库 DOWN 还要结合 exporter 暴露的数据库连接状态指标、应用错误、端口和数据库日志一起判断。
端口和 HTTP 探测一般用 Blackbox Exporter。本文不展开它的完整配置,只记住边界:端口可用性、HTTP 状态码、TLS 证书过期这类“从外部访问服务”的问题,不适合只靠应用自身指标判断。
发布后怎么用监控验证
监控不是只在事故时才打开。每次发布后,都应该用监控做一次验证。
发布后至少看这些:
| 方向 | 指标 |
|---|---|
| 实例 | up、Targets、服务实例数 |
| HTTP | QPS、5xx、4xx、平均 RT、P95 / P99 |
| JVM | 堆、GC 次数和耗时、线程数、进程 CPU |
| 主机 | CPU、load、内存、磁盘、网络 |
| 依赖 | MySQL、Redis、MQ 可用性和错误 |
| 告警 | 是否有新增 firing,是否有通知失败 |
回滚前也要看监控。不要只因为“有人说慢”就立刻回滚,也不要因为“页面没报错”就继续放量。一般按这个顺序判断:
新版本实例是否全部 UP。错误率是否比发布前明显升高。RT 是否持续恶化。
JVM 或主机资源是否异常。下游依赖是否被新版本打爆。告警是否已经触发,是否影响核心链路。
生产建议把监控纳入发布门禁,但不要一开始就做得太复杂。先从几个硬指标开始:实例存活、5xx 比例、P95 响应时间、CPU / 内存、核心依赖可用性。等规则稳定后,再做自动暂停、自动回滚或灰度推进。
常见问题排查
Prometheus 启动失败
先看服务状态和日志:
systemctl status prometheus --no-pager
journalctl -u prometheus -n 100 --no-pager
promtool check config /etc/prometheus/prometheus.yml
常见原因:
YAML 缩进错误。rule_files 指向不存在的文件。数据目录无权限。
端口 9090 被占用。TSDB 数据损坏。
查端口:
ss -lntp | grep 9090查权限:
sudo -u prometheus test -w /var/lib/prometheus && echo ok如果日志提示 TSDB 损坏,不要直接删除数据目录。先停服务、备份目录,再按损坏范围处理。
Targets DOWN
先看 Prometheus 页面上的错误信息,再用命令模拟 Prometheus 访问目标:
curl -v http://node-a:9100/metrics
curl -v http://order-service-a:8080/actuator/prometheus
常见原因:
target 主机名解析不到。端口没监听。防火墙或安全组不通。
metrics_path 写错。应用端点需要认证。HTTPS / HTTP 协议写错。
这里要注意,从目标机器本地 curl 成功,不代表 Prometheus 机器能成功。一定要在 Prometheus 所在机器上测。
scrape 超时
Prometheus 抓取超时一般有三类原因:
网络慢或目标负载高。exporter 采集慢。指标数量太大。
先看:
scrape_duration_seconds
scrape_samples_scraped
scrape_samples_post_metric_relabeling
如果 scrape_duration_seconds 接近 scrape_timeout,就要检查 exporter 采集项、目标机器负载和网络。Node Exporter 额外 collector 不要一次性全开,官方也建议对默认关闭的 collector 谨慎启用,先在非生产或单台生产节点验证。
指标没有数据
按这个顺序查:
curl -fsS http://target-host:port/metrics | head
curl -fsS http://target-host:port/actuator/prometheus | head
promtool check config /etc/prometheus/prometheus.yml
curl -fsS "http://localhost:9090/api/v1/query?query=up"
如果接口有指标,但 Prometheus 没有,多半是 scrape 配置、网络或 label 过滤问题。如果 Prometheus 有指标,但 Grafana 没有,多半是数据源、变量、查询语句或时间范围问题。
Grafana Dashboard 无数据
先确认数据源:
curl -fsS http://prometheus:9090/api/v1/query?query=up再确认 Dashboard 查询里的 label 是否和你的数据一致。社区 Dashboard 经常假设标签叫 job、instance、node,但你的环境可能用了 application、env、cluster。导入后要改变量,不要盲信面板。
还要看右上角时间范围。很多“没有数据”其实是选了最近 5 分钟,但服务刚刚才接入或抓取失败。
Alertmanager 不发通知
先确认 Prometheus 里告警是否 firing:
curl -fsS http://localhost:9090/api/v1/alerts | head再看 Alertmanager 是否收到:
amtool --alertmanager.url=http://localhost:9093 alert query然后查 Alertmanager 日志:
journalctl -u alertmanager -n 100 --no-pager常见原因:
Prometheus 没配置 Alertmanager。告警还在 pending,没有 firing。route 没匹配到 receiver。
silence 命中了。inhibition 抑制了。Webhook / 邮件 / 企业通知网关不可达。
token、密码、证书或代理配置错误。
生产上建议做一次告警演练。比如临时增加一条测试规则,确认从 Prometheus 到 Alertmanager,再到通知群的整条链路都能跑通。
告警太多
告警太多通常不是工具问题,而是规则治理问题。先查:
amtool --alertmanager.url=http://localhost:9093 alert query然后按这几类处理:
同类告警太多:调整 group_by。连锁告警太多:增加 inhibition。瞬时抖动太多:增加 for,调整阈值。
非工作时间维护:使用 silence 或维护窗口。低价值告警太多:降级成 Dashboard 或巡检项。
这里要注意,告警分级一定要明确。建议至少分三类:
| 等级 | 含义 | 处理方式 |
|---|---|---|
critical | 影响核心服务或数据安全 | 立即通知值班人 |
warning | 有风险但未造成核心故障 | 工作群提醒并跟进 |
info | 趋势、容量、巡检提示 | 看板或日报 |
不要所有告警都叫 critical。如果所有事情都紧急,最后就没有事情紧急。
Prometheus 磁盘打满
先确认是不是 Prometheus:
df -h
du -h --max-depth=1 /var/lib/prometheus | sort -h
再看样本增长:
scrape_samples_scraped
scrape_samples_post_metric_relabeling
count({__name__=~".+"})
处理方向:
缩短保留周期。设置 --storage.tsdb.retention.size。拉长不重要目标的 scrape_interval。
减少无用 target。用 metric relabel 丢弃高基数或无用指标。排查应用是否把动态值打成 label。
生产建议给 Prometheus 自己也配置磁盘告警。监控系统自己先挂了,是很难看的事故。
生产最佳实践
监控对象先分层:
| 层级 | 关注点 |
|---|---|
| 主机层 | CPU、内存、磁盘、inode、网络、时间、文件句柄 |
| 容器层 | 容器存活、资源限制、重启次数、日志增长 |
| 应用层 | QPS、错误率、RT、JVM、线程、连接池 |
| 入口层 | Nginx / 网关状态码、上游耗时、连接数 |
| 数据层 | MySQL、Redis、MQ、搜索、对象存储 |
| 业务层 | 订单量、支付成功率、任务积压、核心流程成功率 |
标签要稳定:
环境统一用 env。应用统一用 application。集群统一用 cluster。
团队统一用 team。不把动态值放进 label。
告警要能落到人:
每条 critical 告警都要有责任团队。每条告警都要有排障入口,至少 annotations 里写清楚看什么。维护窗口必须用 silence,而不是临时删规则。
发布期间要关注新增告警,不要因为“发布中”就忽略所有告警。
Dashboard 要治理:
值班首页少而准。专项看板按系统分层。社区 Dashboard 导入后要改变量和标签。
废弃服务的看板和规则要清理。自动刷新间隔不要过短。
权限要收住:
Grafana 不要共享 admin 账号。数据源凭证和通知 token 不写进公开仓库。Prometheus / Alertmanager 管理端口不直接暴露公网。
Alertmanager 静默权限要控制,否则有人可能误静默核心告警。
最后再提醒一句:监控告警要和日志、链路追踪、巡检、发布、应急预案联动。Prometheus 告诉你“哪里异常”,Grafana 帮你看趋势,日志告诉你发生了什么,链路追踪告诉你请求卡在哪,应急预案告诉你下一步谁来处理。
监控告警真正难的不是“跑起来”,而是长期稳定地跑。下面这些问题不提前治理,后面都会变成值班事故:
TSDB 保留周期要用容量倒推,--storage.tsdb.retention.time 和 --storage.tsdb.retention.size 要一起考虑。Prometheus 本地存储不负责跨节点复制和长期归档,长期趋势、审计留痕和多集群汇总要另行评估远端写入或长期存储方案。
高基数标签要设红线。userId、orderId、原始 URL、异常堆栈、动态容器 ID 这类字段一旦进 label,查询会慢,磁盘会涨,甚至拖垮 Prometheus。上线后要定期看 scrape_samples_post_metric_relabeling、topk 和目标样本量。告警不是越多越安全。Alertmanager 的分组、抑制、静默和路由要服务于“谁处理、多久处理、看哪里处理”,没有动作入口的告警只会制造噪声。
权限边界要清楚。Grafana 管理员、数据源编辑、Dashboard 编辑、Alertmanager 静默、通知模板修改不能都给同一批普通账号。单点要写进预案。小环境单 Prometheus 可以接受,但要知道它不是高可用存储;核心环境至少要评估 Prometheus 副本、Alertmanager 集群、通知网关故障和 Grafana 数据库备份。离线资产要有版本锁和校验。Prometheus、Grafana、Exporter、插件、Dashboard JSON、容器镜像都要能在内网复现同一套版本。
升级前先验证规则和数据。升级 Prometheus 前跑 promtool check config、promtool check rules,备份配置和数据目录;Grafana 升级前备份数据库、插件和 provisioning 文件。监控系统也要被监控。Prometheus 自身磁盘、抓取延迟、规则执行耗时、Alertmanager 通知失败、Grafana 登录失败和数据源异常,都应该进入告警闭环。
常用命令速查
服务状态:
systemctl status prometheus --no-pager
systemctl status node_exporter --no-pager
systemctl status alertmanager --no-pager
systemctl status grafana-server --no-pager
日志:
journalctl -u prometheus -n 100 --no-pager
journalctl -u node_exporter -n 100 --no-pager
journalctl -u alertmanager -n 100 --no-pager
journalctl -u grafana-server -n 100 --no-pager
健康检查:
curl -fsS http://localhost:9090/-/healthy
curl -fsS http://localhost:9090/-/ready
curl -fsS http://localhost:9093/-/healthy
curl -fsS http://localhost:3000/api/health
配置检查:
promtool check config /etc/prometheus/prometheus.yml
promtool check rules /etc/prometheus/rules/*.yml
amtool --alertmanager.url=http://localhost:9093 config show
reload:
curl -X POST http://localhost:9090/-/reload
curl -X POST http://localhost:9093/-/reload
Targets:
curl -fsS "http://localhost:9090/api/v1/targets?state=active" | head
curl -fsS "http://localhost:9090/api/v1/query?query=up"
端口:
ss -lntp | grep -E "9090|9093|9100|3000"磁盘:
du -sh /var/lib/prometheus
df -h /var/lib/prometheus
告警:
curl -fsS http://localhost:9090/api/v1/alerts | head
amtool --alertmanager.url=http://localhost:9093 alert query
amtool --alertmanager.url=http://localhost:9093 silence query
Prometheus Overview:https://prometheus.io/docs/introduction/overview/。Prometheus Getting Started:https://prometheus.io/docs/prometheus/latest/getting_started/。Prometheus Configuration:https://prometheus.io/docs/prometheus/latest/configuration/configuration/。
Prometheus Storage:https://prometheus.io/docs/prometheus/latest/storage/。Prometheus Alerting Rules:https://prometheus.io/docs/prometheus/latest/configuration/alerting_rules/。promtool:https://prometheus.io/docs/prometheus/latest/command-line/promtool/。
Alertmanager:https://prometheus.io/docs/alerting/latest/alertmanager/。Alertmanager Configuration:https://prometheus.io/docs/alerting/latest/configuration/。Node Exporter:https://github.com/prometheus/node_exporter。
Grafana Installation:https://grafana.com/docs/grafana/latest/setup-grafana/installation/。Grafana Prometheus Data Source:https://grafana.com/docs/grafana/latest/datasources/prometheus/。Grafana Dashboards:https://grafana.com/docs/grafana/latest/visualizations/dashboards/。
Spring Boot Actuator Metrics:https://docs.spring.io/spring-boot/reference/actuator/metrics.html。Micrometer Prometheus:https://docs.micrometer.io/micrometer/reference/implementations/prometheus.html。